
The PCE Deflator and the Trimmed PCE Inflation Rate Tell Different Stories
Covering April prices, the Bureau of Economic Analysis (BEA) released another widely followed core inflation measure on Friday. Many found it extra concerning. The reason the PCE Deflator received increased attention is that it’s generally the more stable measure and known as the one the Fed prefers (over CPI). It indicated price growth well above the Fed targeted 2% pace. A third inflation measure was also released Friday. Each month the Dallas Fed adjusts the PCE numbers to report this other inflation measure. This additional report rarely receives any investor attention. But, it is worth visiting in that it allows assumptions about what is happening below the economic surface, including consumers’ reaction to prices.
Background
The Fed has said it views a 2% annual increase in inflation as consistent with its mandates of stable prices and maximum employment. The report on April CPI earlier this month indicated a pace, (for the month) well in excess of the target. One month is not a trend, and April certainly has its share of “one-off” issues, including basing growth from April 2020, which printed negative 0.8% with the lockdowns. On Friday, the market couldn’t take much comfort in the PCE Deflator which also could indicate the Fed may have overshot in stimulating the economy. This one April number is not as easy to explain away in that it’s a broader gauge that is less volatile, and generally runs below the CPI average.
PCE Price Deflator
The PCEPI is the Federal Reserve Bank’s favored inflation gauge to help them direct policy. This is according to their own guidance. The reason given is that it is a broader gauge of prices than the basket of goods found in CPI.
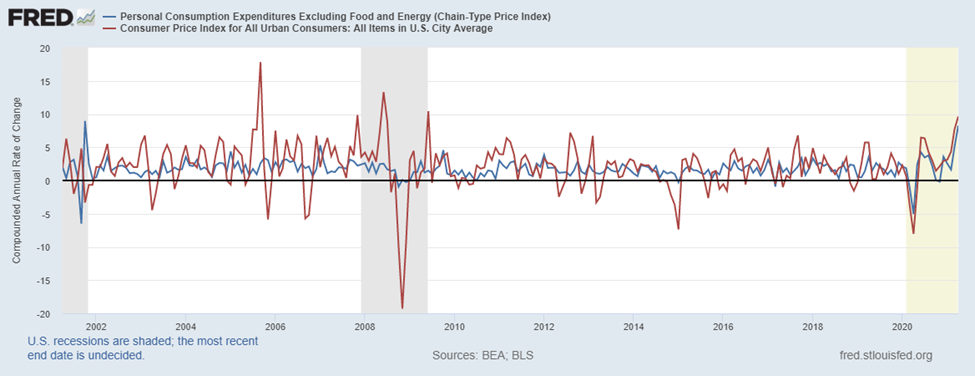
The graph above shows the PCEPI charted against CPI-U for the past 20 years. It’s clear that CPI (red) is much more volatile, and in any given month may change dramatically which is not always the beginning of a change in price growth. By comparison, the numbers based on PCE include a broader base of goods. It also will report net of food and energy, because these often experience large shifts for reasons unrelated to economic price pressures (weather, war, politics, etc.).
| The FOMC carefully considered both indexes when evaluating which metric to target and concluded that PCE inflation is the better measure. – Federal Reserve Bank, St. Louis |
On Friday (May 28), PCEPI showed an annualized rate of inflation of 7.5%, and 8.3% ex-food and energy. This is a spike of the less volatile inflation measure and offers little consolation to those concerned with the higher interest rates that inflation promotes.
The Trimmed Mean PCE Inflation Rate
From the BEA data, the Dallas Federal Reserve Bank is responsible for calculating a monthly set of numbers. Their analysis, The Trimmed Mean PCE Inflation Rate, is an alternative measure of core inflation using PCE.
The Dallas Fed segments off the different goods and services based on price rise and looks at how much they have risen or fallen, then it calculates the actual consumption of those products. So the Fed weights the data based on consumption. One reason for this is it shows that substitutions limit the level of higher prices actually paid by households. If, for example, the price of oranges rise by 6%, while apple prices remain the same, if half the consumers substitute apples for oranges, the experienced household inflation would be overstated if not accounting for the reduced purchases of oranges and increased purchase of zero inflation apples.
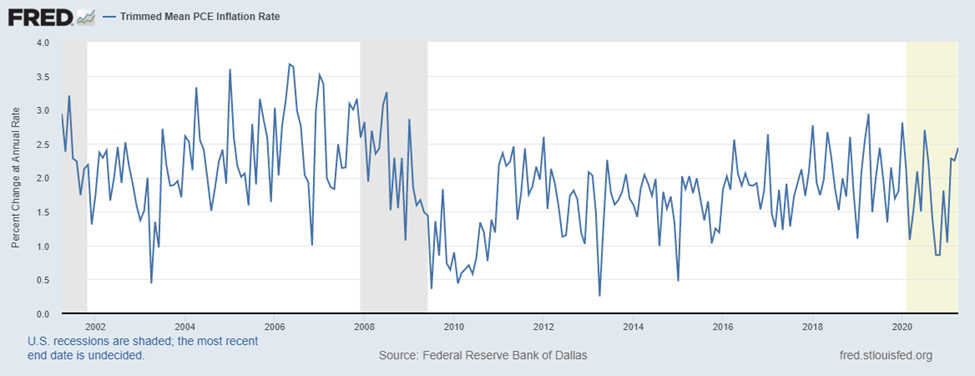
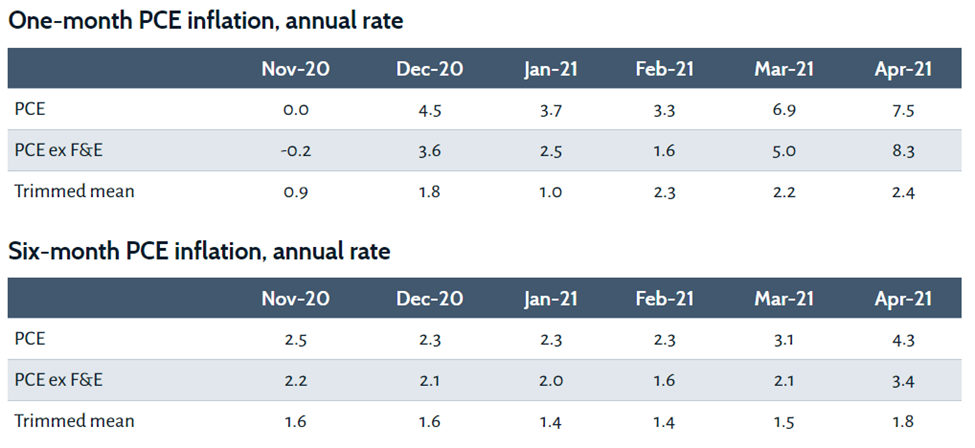
The above Trimmed Mean PCE chart covers the same 20 year period as the top chart. We can see by this alternative measure that inflation is not impacting households in a way that should concern policymakers. In fact, the April numbers shown below indicate a six-month annualized inflation of 1.8%, compared with the PCE Deflator at 4.3%. These are seemingly two different stories.
Source: Federal Reserve Bank, Dallas
Which is Correct?
Giving more weight to one or the other inflation measures would have led to rather different assessments of appropriate policy. The Fed prefers PCEPI over CPI-U for the same reason the S&P 500 is preferred by investors over the Dow 30 as a gauge of stock market movement. An index limited to 30 industrial stocks is not as inclusive as the index that includes 500 of the highest capitalized public companies. When comparing the PCEPI and its derivative Trimmed PCE Inflation, they both need to be viewed knowing what they demonstrate. The actual experienced cost of living change is best reflected in the Dallas Fed number (Trimmed), while economic price pressure is best reflected in the BEA number (PCEPI).
Take-Away
Perception, and expectations of future perception, drive stock prices more than the accuracy and precision of any measure of economic health. One thing for equity investors to keep an eye on, is if the bond market begins to lose faith in tame inflation or the Fed’s ability to keep an even keel, the expectations of equity investors will lean toward lightening up positions. If the bond market doesn’t react by selling off (higher rates), then higher prices of some products should do no more than cause sector rotation within the markets to companies benefiting – not unlike buying apples when you think oranges are priced too high.
Suggested Reading:

|

|
Is Inflation Going to Hurt Stocks?
|
Real Estate Risks to the Stock Market Who Benefits from The Americas Jobs Plan?
|

|

|
Who Benefits from The Americas Jobs Plan?
|
Most Watched Channelchek C-Suite Interviews of 2020
|
Sources:
https://www.dallasfed.org/research/pce
https://www.dallasfed.org/research/pce
https://www.dallasfed.org/research/economics/2019/0528.aspx
Stay up to date. Follow us:
 |
 |
 |
 |
 |
 |
Stay up to date. Follow us:
|
|
|
|
|
|