Image Credit: Medill DC (Flickr)
What Rising Interest-Rates Has Meant for Small and Large-Cap Stocks
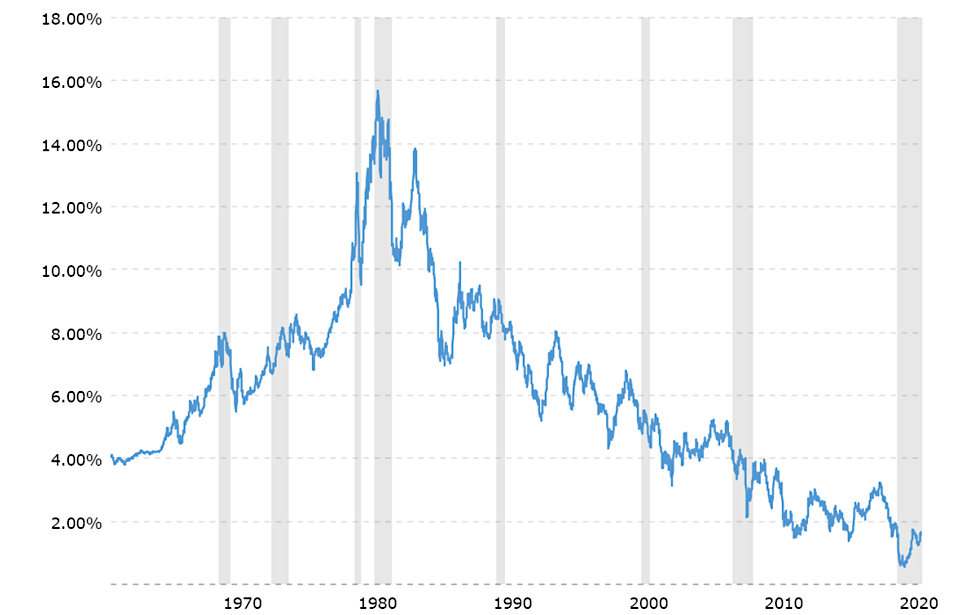
Interest rates, as measured by the US Treasury 10-year note have been below 4% since 2008. The 10-year is an important rate in many homeowners’ lives as it is the benchmark rate for many conventional 30-year mortgages. Rates are currently being held well below most measures of inflation as a part of the Fed’s efforts to maintain a healthy economy. Rates on bonds would naturally have a positive spread over inflation, inflation rates either have to come down, or bond rates should rise.

Source: Macrotrends
Stock market participants are concerned that the current easy money environment is unsustainable and are concerned about what may happen to the markets as the Fed begins to taper and siphon money back out of the banking system. Channelchek’s focus remains on smallcap and microcap stocks. Below we look at what has occurred in the broader small-cap and large-cap sectors during the 12-months following the Fed indicated they’d be more hawkish.
Background
Keeping in mind that the past is not a perfect indicator of the future, let’s look back and see what has occurred to smallcap stocks during each of the 12 month periods after the Fed started reducing economic stimulus.
Absent another surprise shock, the Fed is expected to begin to taper their support of the banking system via reduced bond purchases. They announced today (November 3) that they’d reduce bond purchases by $10 billion per month. The markets have been anticipating this reduction in stimulus since at least the first Covid-19 vaccines were given earlier this year. The stock markets continued to rise despite the threat of tighter money.

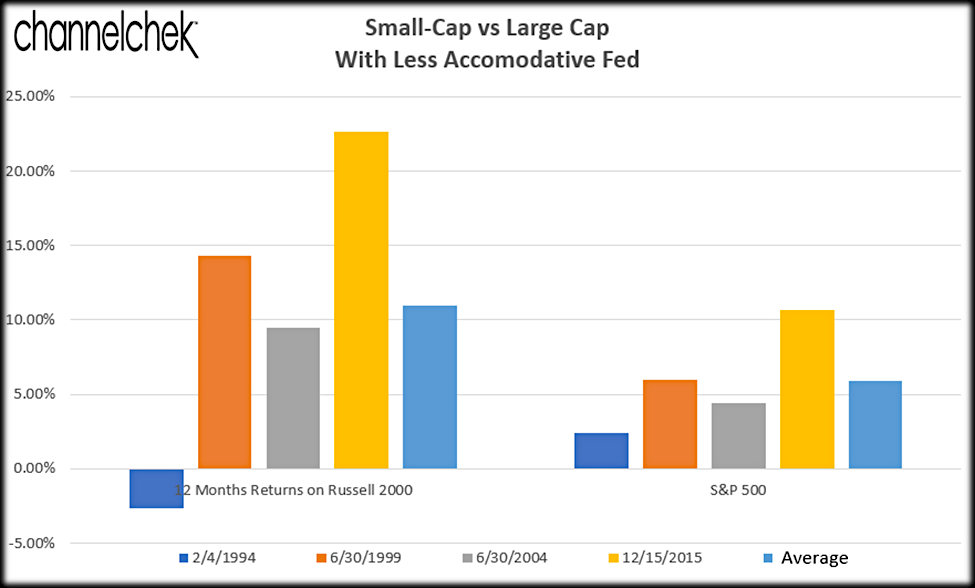
The chart above shows each time the Fed has overtly begun to remove stimulus from the banking system. Specifically, over the past four periods, there has been only one (February 1994) that has been negative for the Russell 2000, and that is the only period that has underperformed the S&P 500 (-2.9% vs +2.41%). The following date the Fed began to be less accommodative was June 1999. Small caps as measured by the Russell index grew 14.32%, large caps as measured by the S&P 500 also rose, but only 5.97%. In June 2004, when the Fed began to tighten, small caps saw a 9.45% return over the following 12 months. During the same period, large caps returned a little less than half at 4.43%. More recently, in December 2015, small caps shot up 22.63% afterwards the Fed began a more hawkish stance; again the large-cap index was also positive but returned less than half at 10.70%
With only one exception, since 1994, each time the Fed began removing stimulus, these two major indexes were positive, small caps returned on average 10.93% over the following year while the large-cap index returned on average 5.88%.
Take-Away
Each time the Fed talks of tightening, the stock market is concerned. Historically stocks are not impacted the way bonds are, and small-cap stocks tend to outshine. We don’t know what will occur over the next year, but looking back, we may not need to be concerned at all.
Sources:
https://www.ajmc.com/view/a-timeline-of-covid-19-vaccine-developments-in-2021
https://www.macrotrends.net/2016/10-year-treasury-bond-rate-yield-chart

