Image Credit: DFB Photos (Flickr)

Stock Market Performance – Looking Back at June, Forward to July
The month of June and the first half of 2021 are behind us, and the halftime scoreboard shows investors are way ahead. However, there are some concerns that those in the markets are carrying with them into July that won’t soon go away. Top on this list is inflation measurements have surprised on the high side over the past few months. Whether this is a long-term trend and part of the new normal will have to either confirm itself in the next few inflation prints or demonstrate it is transitory as the Fed would have us believe. The market’s fear is that stocks are priced for an easy policy (low rate, cheap money) for another year or two. If the Fed moves to tap the economic brake pedal earlier than built into stock prices, the reaction could be cascading stock, bond, and real estate values.
The next scheduled FOMC meeting is July 27-28. By then we will have seen another round of CPI numbers from which to gauge. We’ll also have a more solid idea of what the final infrastructure spending plan will be comprised of. The magnitude of the money flowing out of Washington to fund projects will help raise profits within the affected industries and make winners out of some companies.
Look Back
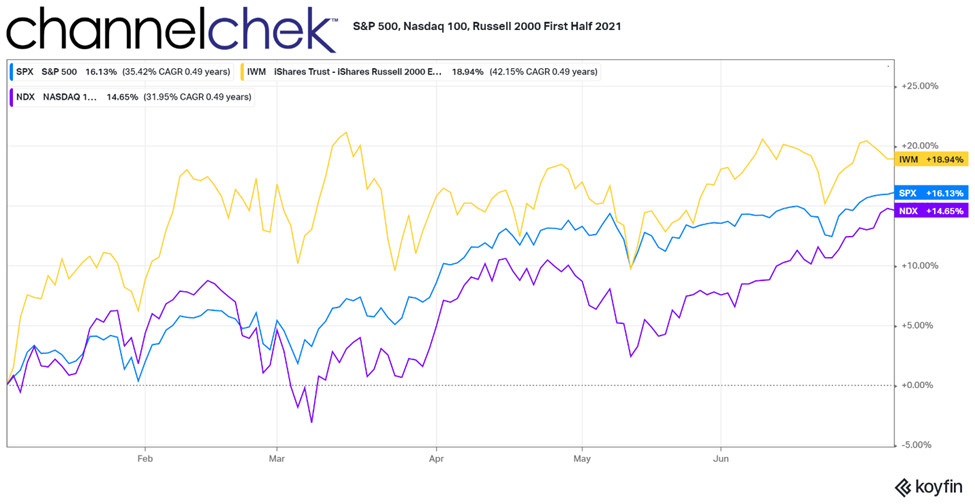
The three broader stock market indices we report on, (S&P 500, Nasdaq 100, and Russell 2000) were positive during June. The S&P 500 gained 1.60%, the Russell 2000 rose 1.02% and Nasdaq 100, which had lost 1.62% in May, was the top performer at 5.69% for the month. Throughout June, the Russell 2000, along with the other FTSE Russell Indexes garnered a great deal of attention as Friday, June 25th was the last day of the old mix of securities making up the index – they reopened on Monday with a reconstitution that significantly lifted the minimum needed capitalization to be included. This was the mathematical outcome based on their guidelines applied to a stock market that experienced significant gains over the previous 12 months.

Viewing the indices from a year-to-date or six-month perspective, all three are well above their historical average pace. The top performer is the Russell 2000 small-cap stock index. Over six months, this measure of smaller companies increased by 18.94%%. The S&P 500, which measures a broad base of large-cap companies, was up 16.13% for the half-year period. And the Nasdaq 100, which was the overall outperformer for much of 2020, lags the other two indices with a still-respectable 14.65% increase.
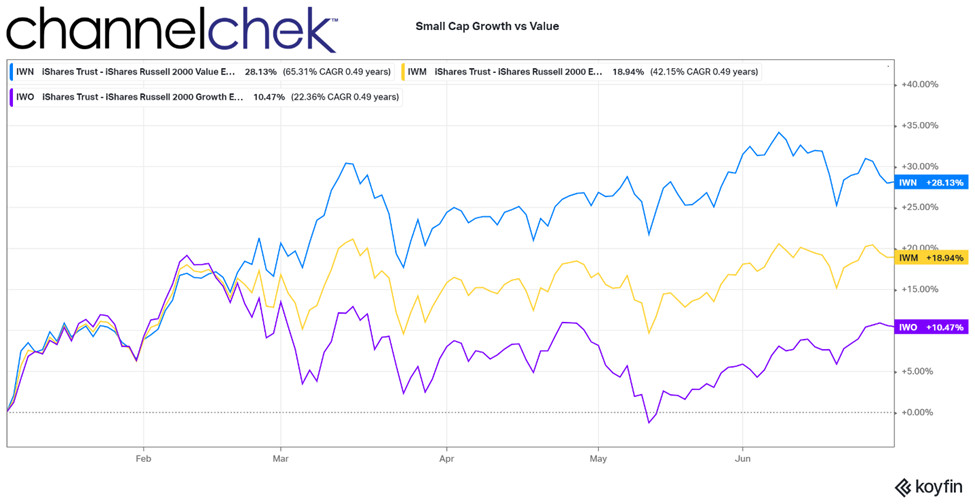
To Further segment the better performing Russell 2000 small-cap index (6-months), Value continues to outperform Growth by a wide margin. While a 10.47% return on small-cap Growth over six months is well above average, it is dwarfed by the 28.13% return provided by small-cap Value.
Hottest Market Sectors
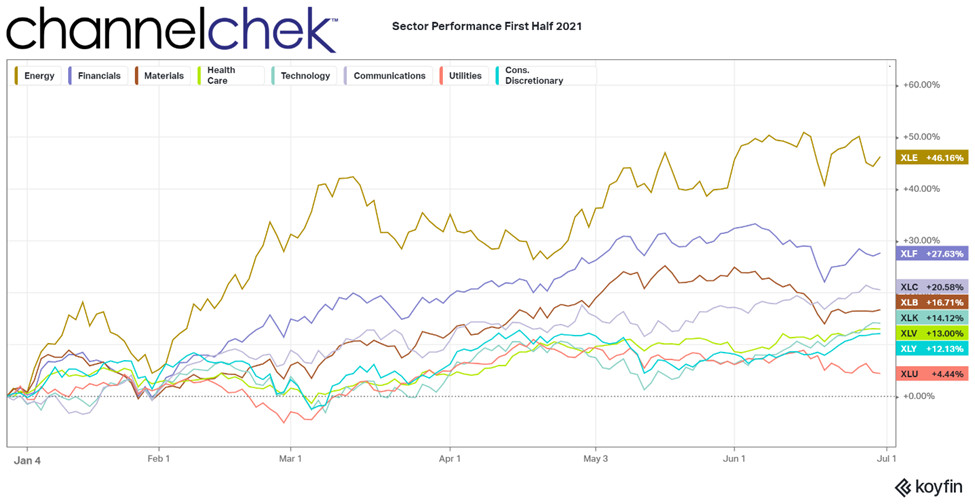
Over the measured six months (January – June), the industry sectors have rotated positions from late 2020. Energy, which had been beaten up and left for dead through much of last year, rose 46.16%. Financials are up 27.63% in just six months’ time. The Financial sector is benefitting from expectations of a steepening yield curve and a large supply of cash in the system. Communications companies that have benefitted from a growing online economy may be among the beneficiaries of infrastructure spending. The sector was the third-best performer at 20.58%. The worst performing sector for the first half is Utilities. The utility sector provided a 4.44% return, which is still in line with the 8-10% average market return discussed in textbooks and touted by advisors. Utility stocks are popular among retirees for their dividend payments; higher interest rates would provide alternatives for income/dividend investors.
Take-Away
The economic report to be released in July which carries the most potential impact is CPI. The Bureau of Labor Statistics will make these numbers available at 8:30 EST on July 13. The statement after the two-day FOMC meeting later in the month also has the potential to be a turning point in sentiment. Some voting and non-voting members of the committee already have publicly supported beginning to taper the loose money policies sooner than originally planned. Any notching up of rates in 2021 would happen well in advance of the expectations the Fed set for the markets through April of this year.
With this, the most intense volatility could surround July 13th, with CPI numbers, and July 28th, after the FOMC adjourns. Other dates worth noting include Friday, July 2, when Nonfarm Payrolls are reported. Coupled with payrolls is the Labor Participation Rate. A low participation rate and high unemployment could suggest future wage inflation as employers find ways to induce needed workers to the open positions. Look for an announcement on July 8 as the OPEC Plus meeting adjourns. Any agreement out of Washington related to a bill passing on infrastructure spending should also impact the markets. If spending is smaller than the $1.2 billion proposed on June 24, 2021, the market could be disappointed.
Managing Editor, Channelchek
Suggested Reading:

|

|
Stock Market Performance – Looking Back at May, Forward to June
|
Inflations Impact on Stocks, Four Scenarios
|

|

|
Money Supply is Like Caffeine for Stocks
|
Who Benefits from the American Jobs Plan?
|
Sources:
Stay up to date. Follow us:
 |
 |
 |
 |
 |
 |
Stay up to date. Follow us:
|
|
|
|
|
|