
Is it Proper to Yell “Market Crash” on a Crowded Message Board?
Headlines in the financial news of a coming “market crash” have caused a lot of conversation on message boards, social media investment sites, and even on broadcast media. Below is a “study” I conducted inspired by several posts I’ve come across, including one on WallStreetBets by someone named u/geniusmanchild. I decided to investigate two things. First, is the term “market crash” being searched on the internet more than normal, and second, when “market crash” is running well above average in searches, is it followed by market weakness or a sell-off. This is largely an unscientific study, but I believe the results are very telling when perception is matched against measurable data.
Google Trend is Your Friend
As a quick intro for those unfamiliar, there’s a Google tool called Google Trend. It allows you to put search terms and date ranges to discover when searches for that term were strongest. For each search, there’s a period identified that represents the peak of searches for the whole date range. A score of 100 is given to this peak period. All of the other periods are ranked against this; for instance, half as many searches would be given a score of 50.
Google Trends, Search Term Market Crash
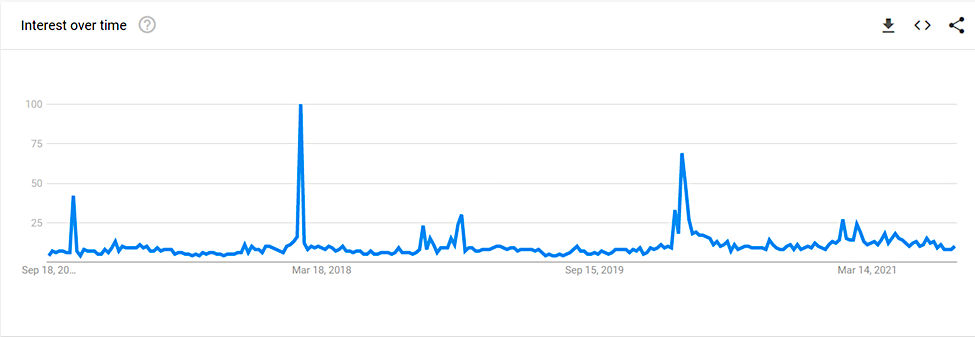
Above is the Google Trend representation of user interest in “Market Crash” for the five years ending September 11, 2021. The Google Trend output shows from February 4th to February 11, 2018, the maximum number of Google users searched for “market crash.” There have only been six times other than this 100-point period during these five years where the results were above 25. I’ve compared these periods against the moves (shown below) for the S&P 500, Nasdaq 100, and Russell 2000 one week after.
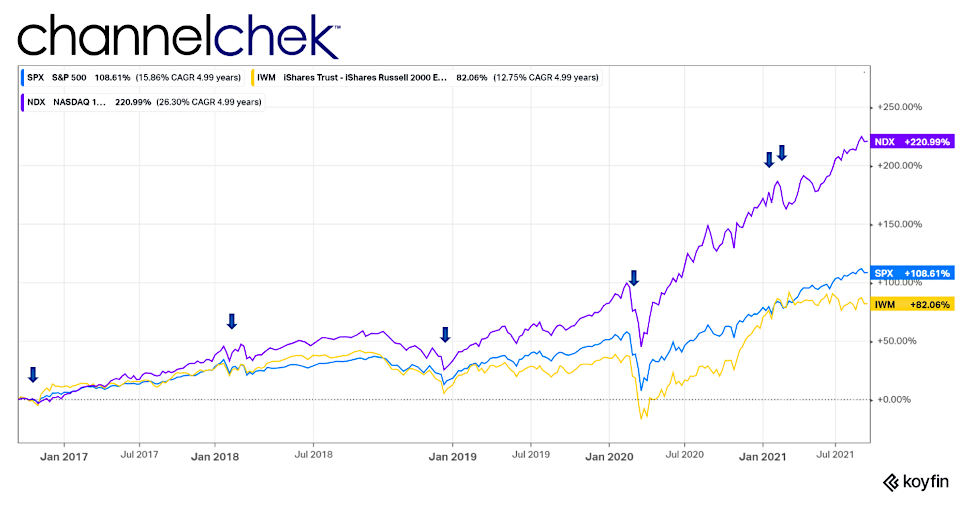
For the period November 6- November 12, 2016, the search term scored a 42. This is the first arrow to the left on the chart. The following week the Russell 2000 roared upwards to 9.53%, the S&P 500 was up 3.70%, and the Nasdaq 100 rose .9%. The markets did not crash following this period where a crash was being discussed. The next period was the peak of 100. This occurred from February 4- February 11, 2018. Despite the concerns, the S&P index rose the following seven days by 5.26%, the Russell 2000 gained 5.39% and the Nasdaq 7.43%. The market didn’t retrace to where it was that week for over a year.
The last quarter of 2018 was rough. Google Trends “Market Crash” showed a score of 30 between December 23 and December 29. The height of the chatter seemed to mark the bottom of a sell-off as the indexes didn’t revisit the December 2018 low for years afterward. During the last week in February 2020 and the second and third week in March Google Trend again crossed the 25 mark reaching as high as 69 during March 8- March 14. Here we did see a sell-off in the indexes. The S&P 500 the following week was down 18.98%, The Russell 2000 sunk 14.83%, and the Nasdaq 100 fell by 20.77%. One month later the S&P 500 and Nasdaq were above the beginning of the fall. The Russell 2000 was close to breakeven. They have not revisited these lows since. From January 24, 2021 through January 30, Google Trends was abuzz with people searching “market crash.” The following week the S&P 500 rose by 8.07%, The small-cap Russell 2000 climbed by 13%, and the Nasdaq 100 rose 14.08%. On the week ended February 21st, there was a lot of clamoring again with people searching. There was never a huge selloff, but the following week the S&P 500 lost 1.44%, the Russell 2000 shaved .49%, and Nasdaq was down 1.46%.
Take-Away
The most recent read on Google Trends is that the search term is at the 10 level. I began by saying this is not a scientific evaluation. However, for this short time period one might surmise that when people begin fearing the crash is near, there is ample room for markets to continue to rise. I’ll have to soon run the same analysis on the search term “Market Rally, ” and report those results.
Managing Editor, Channelchek
Suggested Reading:
 Why Investors Have Consistently Bought the Dip Since 2021
|
 Should Investors Listen to Influencers?
|
 How Much is a Trillion?
|
 SEC Investigates Digital Engagement Practices in Broker Apps
|
Sources:
https://app.koyfin.com/share/f52864aadb
https://trends.google.com/trends/explore?date=today%205-y&geo=US&q=market%20crash
Stay up to date. Follow us:

|