
Historically, Tightening Cycles Have Not Caused Long-Lasting Market Damage
The Fed does not plan on having a tight monetary policy, just a less easy one.
On March 16, 2022, the FOMC Committee announced their intention to target a fed funds rate that would be 0.25% higher than it had been. It was the first increase since December 2018, and the hike more than doubled this key interest rate. Fed Chair Powell made it clear it would not be the Committee’s last.
Less than two months later, on May 4, the Fed adjusted the overnight target by an additional 0.50%. This was the largest increase since the year 2000. But they were just getting started. They suspected they had fallen behind in their mandate of keeping inflation down. Stable prices generally mean balancing supply and demand, and since the Fed couldn’t do much to raise the consumable supply, they acted to dampen demand. They made money more expensive. In mid-June, the Fed hiked by 0.75%, in late July it pushed them up by 0.75% again, and that was the last time the FOMC met.
The next meeting will be held September 20-21st. The perceived guidance is that they will raise rates again by a similar amount as they did in June and July.
Tightening Cycles
The current tightening cycle is a concern for those that fear that it may lower asset prices and lower business activity. The concerns are warranted as tightening cycles are designed to do exactly that, tame prices and slow economic growth. It’s tough medicine but is supposed to provide for better economic health long term.
Over the past 30 years, the Fed has convened four recognized tightening cycles – periods when it increased the federal funds rate multiple times.
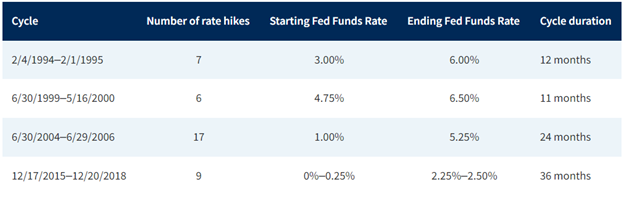
Over three decades, the median number of rate hikes per period is eight, and the median time frame is 18 months (from first to last). How has the economy and markets fared through this recent history? Only two of the periods, the one ending in 2000 and then in 2006, were associated with a recession. In all four cases, the market retreated at first.
If one uses GDP as a measuring stick for an economy that is either growing or receding, then the U.S. was in a recessionary economy for a calendar quarter before the initial 0.25% hike. So the tightening may not put us into a recession, but it does have the potential to retard growth further for a deeper recession.
Market Performance
Markets have traded lower in the months following the start of a tightening cycle, but in each of the periods defined above, they have ended higher one year later. It would seem that the market fear of what slower growth would do for companies and stock prices were front-loaded; those fears then gave way to buying as expectations became better defined.
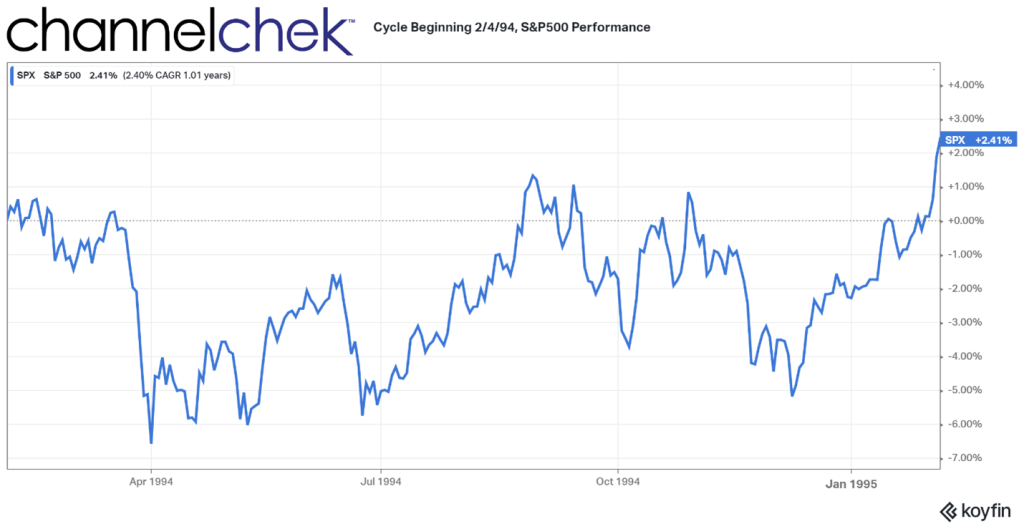
For the tightening cycle that began in 1994, a year after the Fed first took aim at the economy, the S&P 500 Index had already bounced off its low and climbed rapidly to end the 12 months with a positive 2.41% return. At it’s worst, the index had given up 6.50%.
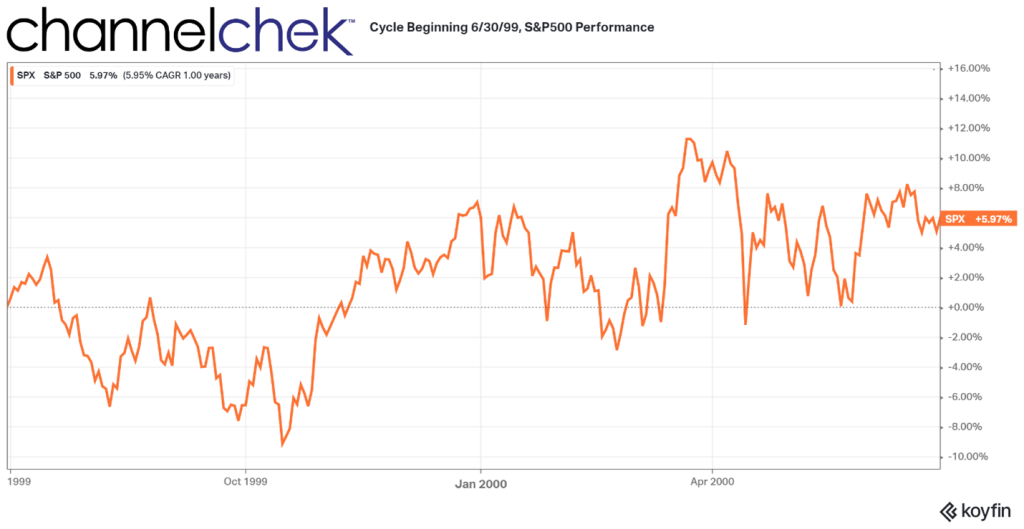
Four months after the tightening cycle began in 1999, the market began marching higher and crossed the breakeven point three times. The first time in August, just 45 days into the cycle, and the last one in May of 2000. For the 12-month period an investor in the index would have gained 5.97%.
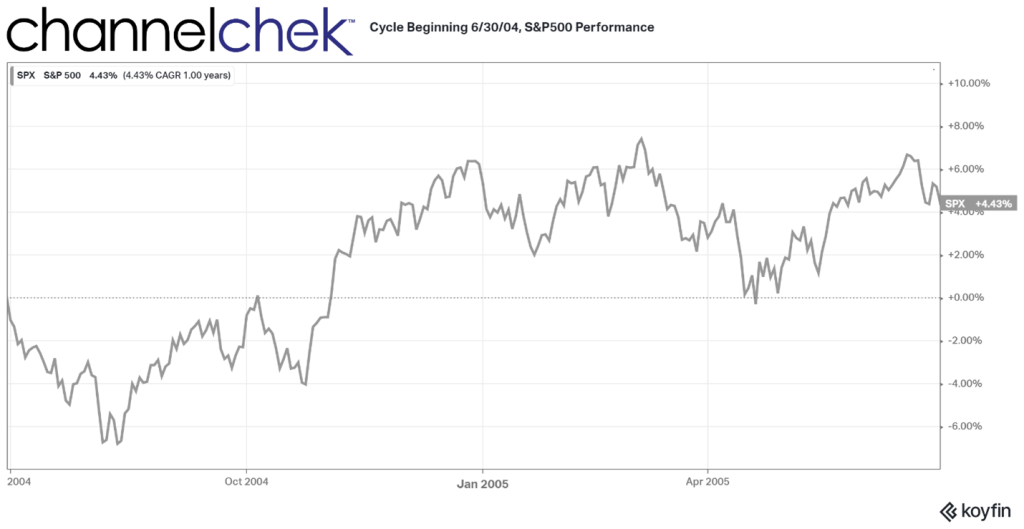
In 2004 the tightening cycle again began on June 30. Stock movement over the 12 months that followed are very similar as 1999. For investors that held for five months, (assuming their holdings approximated this benchmark) they were treated with returns of 4.43% 12 months later.
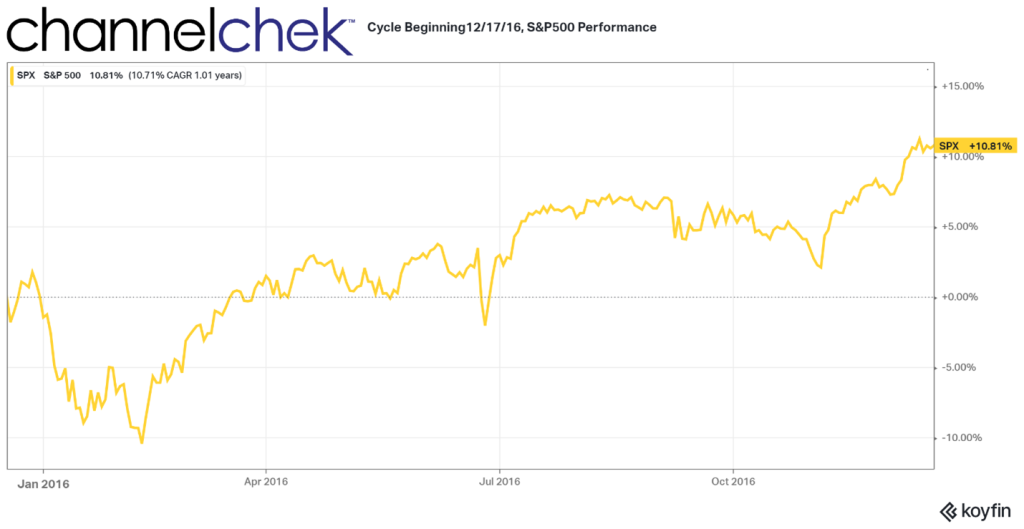
The most recent tightening cycle was seven years ago and began in December. Those invested in securities in 2015 that followed the overall stock market quickly broke even, and for those that held, they were up 10.81% a year later.
On average over the four periods the S&P 500 returned better than 6% after the Fed began a prolonged tightening cycle. The median drawdown is observed to be 9% in the first 49 days following the Fed’s first rate hike. For those that were invested in stocks that were more closely correlated to other indices, their experience was different.
Other Indices (Small Cap, Value, Growth)

The best average, although it did have a negative return in one of the periods, is the performance of the small cap Russell 2000 index. Investors in small cap stocks would have earned almost twice as much (11.30%) as those invested in the S&P 500 Large cap, almost three times as much earnings as those invested in the Russell 1000 Value stocks, and far more consistent and more than three times the Russell 1000 Growth index.
Take Away
This is not the first time the Federal Reserve has raised rates and implemented a tighter monetary policy. In the past it has not meant doom for the economy. In fact, the policy shift is intended to preserve a healthy economy before it begins causing larger problems for those that depend on jobs and stable prices along with a orderly banking system.
The most recent tightening cycle began six months ago. If history is an indicator, it may last another year, during that time stocks will rebound to a level higher than they were in March when the cycle began. While there are no guarantees that history will accurately point to the future, it helps to know what happened the last four times. Investors may also look to increase their allocation into small cap stocks as they have by far outpaced other indices.
Managing Editor, Channelchek
Sources
https://www.federalreserve.gov/datadownload/Choose.aspx?rel=PRATES
https://www.forbes.com/advisor/investing/fed-funds-rate-history/