Consumer Inflation and the Impact of Producer Prices
Inflation, its impact on interest rates, the cost of employees, corporate profits, and global competitiveness, is creating more anxiety than it has in decades. Since 2008, economists were more likely to be concerned and debate how to stave off deflation. That fear seems like a distant memory since $6 trillion has been added to the economy over the past year. March’s change in consumer inflation is released this week. The release will give the market a renewed glimpse of how much price appreciation consumers have sustained from shortages and trillions of more dollars chasing the same or fewer goods and services.
One factor that may have already had a big impact on March consumer inflation are the quickly rising producer prices. The Bureau of Labor Statistics reports Producer Price Index (PPI) monthly on the previous month’s data for a few days before the Consumer Price Index (CPI) is released for the same month (PPI was released 4/9. CPI will be reported on 4/13).
PPI’s Warning
Producer prices, as reported Friday, April 9, increased 1%. This is a significant jump. In fact, it is double the rate economists expected and up from 0.5% in February. This sharp rise of costs to produce and the reported success in passing the higher wholesale costs on to consumers and small business owners indicates it will work its way into final CPI numbers in short order.
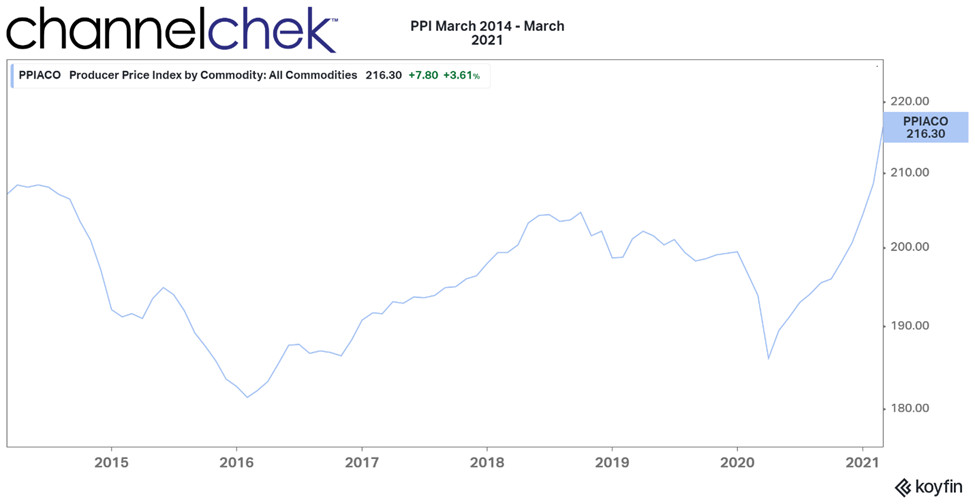
Comparing the increase to March of last year, the PPI jumped by 4.2%, this was the sharpest year-over-year increase since 2011, according to the BLS.
Producer Price Index, Month Over Month Change

Next month’s release of both PPI and CPI are more than likely to show dramatic YOY increases. Much of this can be discounted as inflation during April last year plunged by 1.1% in response to new lockdown orders. This low inflation month is the basis for one-year measurement. The name for this distortion is the “base effect,” and investors should be aware of it before they are startled by what looks to be rampant inflation without the context of what happened last April distorting the YOY measure.
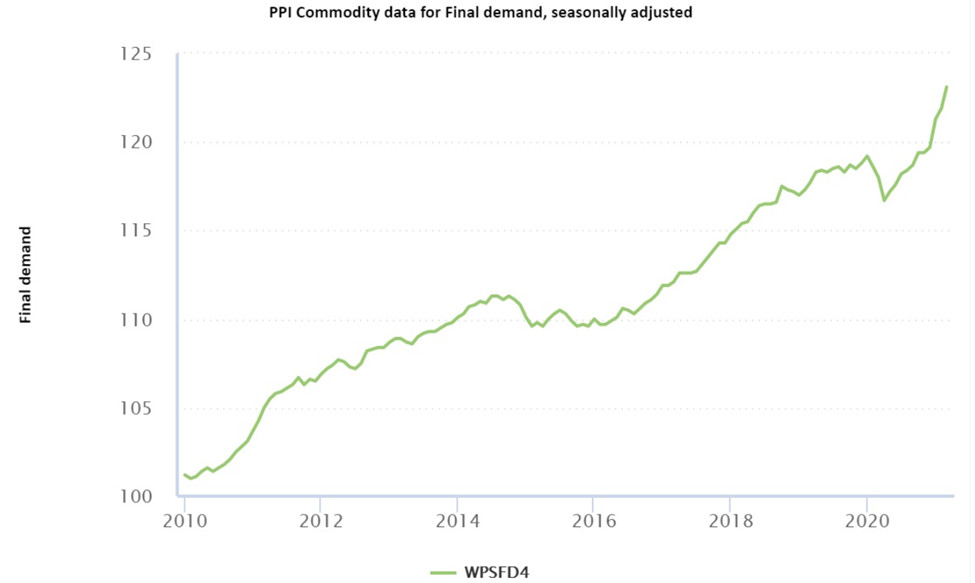
We can see from the BLS chart below that PPI hit a high in January 2020 with an index value of 119.2. In February and March last year, it dropped 0.5% from the prior month, and in April, it plunged 1.1% to an index value of 116.7, partly driven by the collapse in fuel prices. It has been rising ever since.

Source: U.S. Bureau of Labor Statistics
Looking Forward
What might April prices look like? The most recent index value is 123.1, which is 5.5% higher than April 2020. If the PPI rises 0.5% this month (April) from 123.1, it adds up to a 6% year-over-year increase. This would be the highest since November 2009, when the U.S. economy was awakening from the financial crisis. After April’s data, the issue with base measurement will have already been taken into account, leaving May’s numbers (reported in June) as a fresh start without basis problems.
Take-Away
Inflation pressures are giving way to higher prices in the manufacturing and services pipeline. The producer price index is showing significant increases even when netting out the base effect. Companies are reporting they are successfully passing these costs on to the consumer. This means higher CPI down the road, which will lead to greater challenges for the Fed to fulfill its commitment to low rates through next year.
Suggested Reading on Channelchek:

|

|
Winners and Losers in the American Job Plan
|
IRA Investments and Small-Cap Stocks
|

|

|
Are Inflation and Interest Rates Expected to Rise
|
$1.9 Trillion in Terms We Can Better Relate to
|
Sources:
https://www.bls.gov/news.release/pdf/cpi.pdf
https://www.bls.gov/news.release/ppi.nr0.htm
https://www.markiteconomics.com/Public/Home/PressRelease/6123ab3169954de186a8b7c543eb6035
Stay up to date. Follow us:
 |
 |
 |
 |
 |
 |
Stay up to date. Follow us:
 |
 |
 |
 |
 |
 |
