
INTERNET AND DIGITAL MEDIA COMMENTARY
Signs of Life
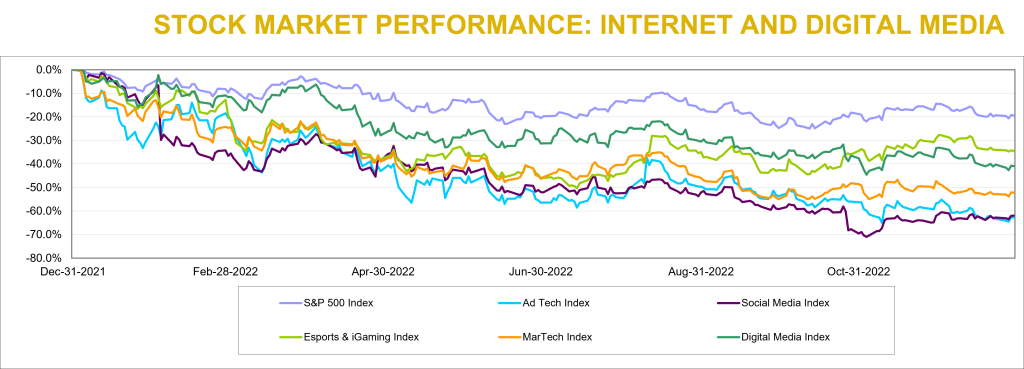
The S&P 500 increased by 7% during the fourth quarter of 2022, marking the first time the Index had increased since fourth quarter of 2021. We also saw signs of life in two of Noble’s Internet and Digital Media Indices: Noble’s eSports and iGaming Index increased (+13%) and outperformed the broader market (which we define as the S&P 500) while Noble’s MarTech Index also increased (+6%), roughly in-line with the market. This marked the second quarter in a row in which the eSports and iGaming Index not only increased but significantly outperformed the broader market, following several quarters of underperformance. Laggards during the fourth quarter were Noble’s Digital Media Index (-5%), Social Media Index (-7%) and Ad Tech Index (-20%).
Noble Indices are market cap weighted, and we attribute the relative strength of the eSports and iGaming Index to its largest constituent, Flutter Entertainment (ISE: FLTR). Flutter shares finished the year at $127.80, down only 8% from the start of the year, despite trading as low as $76 per share in mid-July. Investors appear to appreciate Flutter’s FanDuel business and its market leading position and competitive advantage, something that Flutter management highlighted during a November Investor Day. Management also laid out a case to increase U.S. revenues by 5x and achieve margins of 25%-30% implying EBITDA of up to $5 billion in 8 years-time, quadruple its levels today. Despite the overall strength of the eSports and iGaming Index, share price gains within the sector were not widely dispersed. Only 3 of the 16 stocks in eSports and iGaming sector finished the quarter up, including Engine Gaming and Media (GAME, +71%) and SportRadar Group (SRAD; +13%).
Noble’s MarTech Index increased by 6% with 11 of the 22 stocks in the index posting gains, led by Yext (YEXT; +46%), Shopify (SHOP; +29%), LiveRamp (RAMP; +29%) and Adobe (ADBE; +22%). This marks significant improvement from last quarter when only 4 of the sectors’ stocks finished the quarter in positive territory. MarTech stocks have suffered from a market resetting of revenue multiples which began when the Fed began raising rates. MarTech share price declines in the first, second and third quarters of 2022 were mostly driven by multiple compression as investors rotated out of high-flying tech sectors where companies had chased growth at all costs (at the expense of profitability). Only 7 of the MarTech companies in the Index posted positive EBITDA in the latest quarter.
2022 – A Year That Internet and Digital Media Investors Would Like to Forget
While there were signs of life in the fourth quarter of 2022 for the Internet and Digital Media sectors, 2022 was a year most investors in these sectors would like to forget. Every one of these sectors substantially underperformed the S&P 500 last year. The S&P 500 Index finished the year down 19% which was substantially better than Noble’s eSports and iGaming Index (-35%), Digital Media Index (-41%), MarTech Index (-52%), Social Media Index (-63%), and Ad Tech Index (-63%). Rather than focus on the stocks that significantly underperformed their respective Indices (and there are many), we would rather focus on the three stocks that finished 2022 up for the year.
- Harte Hanks (HHS) – Shares of Harte Hanks increased by 53% in 2022, which continued its multi-year turnaround from a highly levered and unprofitable business (in 2019), to a double-digit EBITDA margin business with a debt-free balance sheet (in 2022).
- Tencent (TME) – Shares of Tencent increased by 21% in 2022. Shares declined earlier in the year as China’s economy slowed as it maintained its Zero Covid-19 lockdown, but surged in the fourth quarter as it appeared that the company would enjoy an increase in demand as China begins easing Covid restrictions.
- Perion Networks (PERI) – Perion shares increased by 5% in 2022 as Perion consistently beat expectations and raised its guidance throughout 2022. In the first week of 2023, the company once again pre-announced better than expected results for the fourth quarter, and shares are already up 18% since the start of the new year.
2022 M&A – A Tale of Two Halves
When we look back at last year from an M&A perspective, we can say that 2022 was another year of robust M&A activity. The total number of deals increased by just under 2%, as we tracked 667 deals in 2022 compared to 657 deals in 2021. Deal values were up a robust 71% in 2022 to $241 billion, up from $141 billion in 2021. The fact that deal value was so significantly higher happened despite the fact that there were far fewer deals where the transaction value was disclosed in 2022 compared to 2021. In 2022, there were 184 deals where the purchase price was disclosed, significantly lower than the 264 deals where the purchase price was disclosed in 2021.
2022 – A Year of Mega Deals
The biggest difference between 2022 and 2021 was two “mega” deals that were announced in 2022: Microsoft’s $69 billion announced acquisition of Activision Blizzard (which the Federal Trade Commission is seeking to block) and Elon Musk/Kingdom Holding’s $46 billion acquisition of Twitter. In fact, there were six transactions in 2022 that exceeded $10 billion in deal value, while there were only 2 such deals in 2021. Five of the 6 largest transactions of 2022 took place in the first half of the year. Half the largest M&A deals in 2022 were in the video or mobile gaming sector.
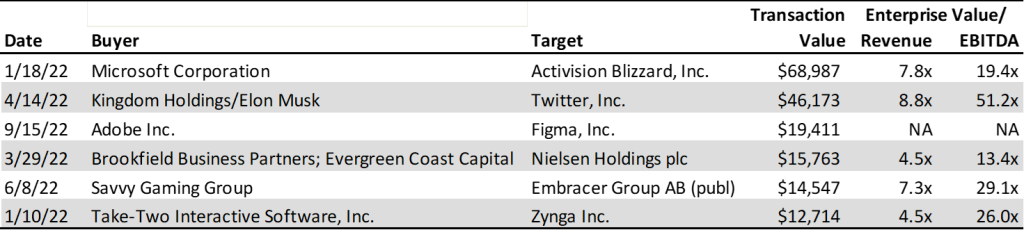
Only Adobe’s $19 billion announced acquisition of Figma took place in the second half of the year, which is not surprising given that the cost of financing M&A transactions using debt increased by approximately 300 basis points as the Fed continued to raise rates to fight inflation. Given the higher cost of financing deals, in 2023 we are not likely to see as many mega deals particularly at the relatively elevated EBITDA multiples shown above.
4Q 2022 M&A: A Chink in the Armor – M&A Activity and Deal Values Slide
Through the first three quarters of the year in 2022, we noted how well M&A had held up despite public equity market declines, Fed rate hikes, elevated inflation, contractionary monetary policy and geopolitical conflict. While the M&A market stayed resilient throughout most of 2022, it is clear that we began to see some “chinks in the armor” in 4Q 2022. We are not surprised by this relative weakness given the economic uncertainty and an inability to accurately forecast revenue and earnings trends for both acquirors and target companies alike.
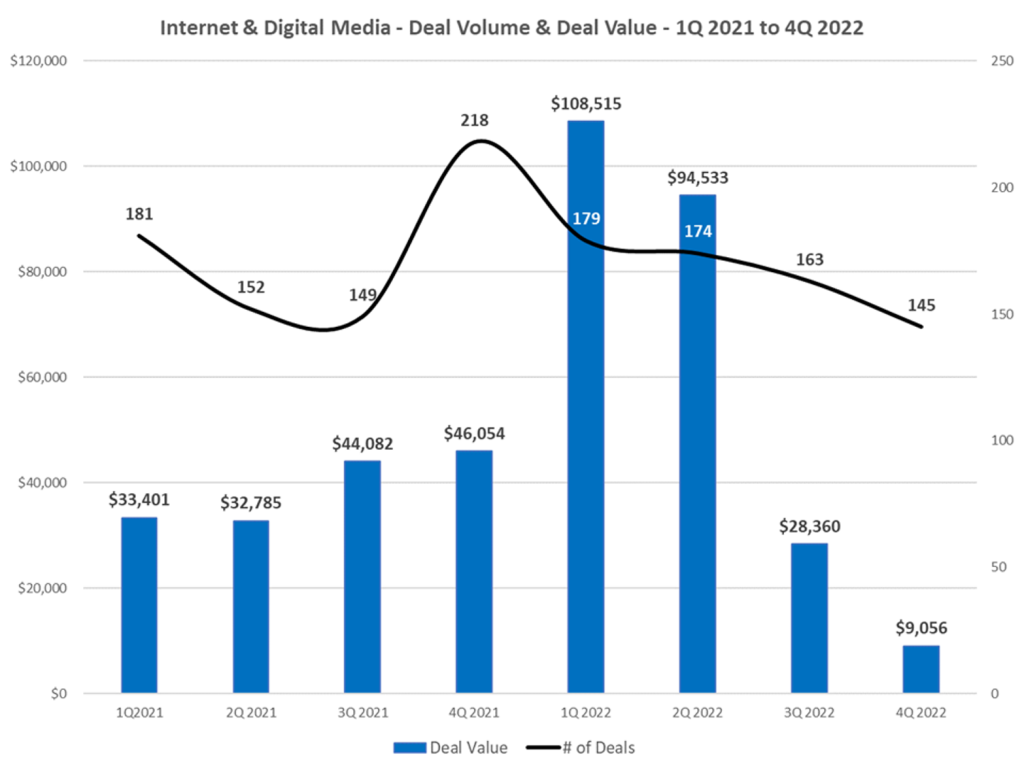
Deal making in the fourth quarter of 2022 slowed both from a deal volume and deal value perspective. The total number of deals we tracked in the Internet and Digital Media space fell by 17% to 145 deals in 4Q 2022 compared to 174 deals in 4Q 2021. On a sequential basis, the total number of deals fell by 14% to 143 deals compared to 167 deals in 3Q 2022.
The biggest change was in deal value, where the total dollar value of deals fell by 70% to $9.1 billion in 4Q 2022 compared to $30.1 billion in 4Q 2021. On a sequential basis, deal value fell by 69% in 4Q 2022 from $29.1 billion in deal value in 3Q 2022.
The tale of two halves is best represented by the chart below.
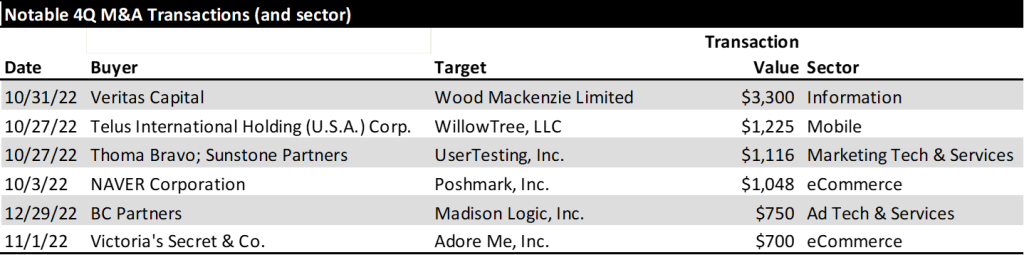
From a deal volume perspective, the most active sectors we tracked were Digital Content (40 deals), Marketing Tech (36 deals), Agency & Analytics (32 deals) and Information Services (12 deals). From a deal value perspective, the Information Services sector had the largest dollar value of transactions ($3.3 billion), followed by eCommerce ($1.7 billion), Mar Tech ($1.2 billion), and Mobile ($1.2 billion).
During the fourth quarter there were a dozen announced deals in the video gaming sector, but the sector did not register as a top sector based on deal value. In fact, only 2 of the 12 deals that were announced included the purchase price: Churchill Down’s $250 million acquisition of horse racing game provider Exacta Systems and Playstudios’ $97 million acquisition of mobile game developer Branium Studios. The largest deals in the quarter by dollar value are shown below.
Digital Advertising
Digital Advertising Outlook for 2023
Last October eMarketer revised lower its 2023 U.S. digital advertising forecast by $5.5 billion, from $284.1 billion to $278.6 billion. While this sounds like a substantial drop, in percentage terms they lowered their 2023 forecast by only 2 percentage points, from 14% growth to 12% growth. Most of the global ad agencies expect digital to continue to grow by double digits driven by dollars migrating to such digital ad channels as retail media and connected TV. Both sectors continue to demonstrate impressive growth.
Retail Media – A retail media network is a retailer-owned advertising service that allows marketers to purchase advertising space across all digital assets owned by a retail business, using the retailer’s first-party data to connect with shoppers throughout their buying journey. eMarketer forecasts that retail media ad spending in the U.S. grew by 31% last year to $41 billion and will grow to $61 billion over the next two years, by which time it will equate to 20% of all digital advertising. The leaders in retail media are Amazon, Walmart and Instacart.
Through a retail media network, partners (advertisers) get direct access to a retailer’s customers. The benefit to the partners/advertisers is that they get access to first party data. Retailers own and store this data and allow advertisers to access them through their retail media programs. The first party data is valuable because it is collected at the point of sale allowing brands to get better insights into purchase behavior. Traditional retailers are beginning to follow suit. Traditional retailers with the largest digital audiences (per comScore) are Walmart, Target, Home Depot, Lowes, CVS, Walgreens, Costco and Kohls.
On January 10th, Microsoft announced that it intended to create the industry’s most complete omnichannel retail media technology stack supported by its Promote IQ platform, a company Microsoft acquired in 2019. We expect companies that serve the retail media sector from an Ad Tech or Mar Tech standpoint are poised to benefit from secular trends in this sector.
Connected TV (CTV) – Last July, Nielsen announced that for the first time U.S. streaming TV viewership was larger than cable TV viewing. In July 2022, eMarketer forecast that CTV advertising would reach $18.9 billion in 2022. However, in October 2022,
eMarketer raised its forecast for CTV advertising by $2.3 billion to $21.2 billion in 2022. In October, the forecaster also raised its 2023 CTV advertising forecast by $3 billion to $26.9 billion, up from $23.9 billion in the July 2022 forecast. The big increase is due primarily to Netflix and Disney+ announcing they were launching ad supported tiers to their streaming offerings.
The ability to target specific audiences and measure specific outcomes tied to the ads that viewers watched has made CTV a force to be reckoned with, particularly for those advertisers that are never quite sure which of their advertising mediums provide the highest returns. Historically, TV was a mass medium used by large brands that wanted massive reach. CTV has opened the door to a wider variety of advertisers that are looking to reach more targeted, even niche, audiences. According to MNTN, a connected TV performance marketing platform, many CTV advertisers are first-time TV advertisers. With new FAST (Free Ad-Supported Streaming TV) channels coming online every month, there is no shortage of supply coming to market. This is just one reason why eMarketer predicts CTV advertising to grow by $10+ billion over the next two years and reach nearly $32 billion in advertising revenue in 2024. Ad Tech or Mar Tech companies that serve this market are also poised to benefit from secular viewing trends and the advertising dollars that are migrating to these platforms.
TRADITIONAL MEDIA COMMENTARY
The following is an excerpt from a recent note by Noble’s Media Equity Research Analyst Michael Kupinski
Overview – Will It Be A Happy New Year?
2022 was one of the worst for media stock performance in recent memory, with stocks across traditional and digital media sectors down over 40% or more. Media stocks underperformed the general market, as measured by the S&P 500 Index, which was down a more moderate 19% on a comparable basis for the full year 2022. It is typical for media stocks to underperform in a late-stage economic cycle or in the midst of an economic downturn, but the significant stock declines are stunning. Macro-economic issues including inflation, rising interest rates, and the prospect of a looming economic downturn all contributed to the poor performance.
The question is “will 2023 be better?” We believe so. There has been recent signs of life. The S&P 500 increased by 7% during the fourth quarter of 2022, marking the first time the Index had increased since fourth quarter of 2021. Notably, the Noble Publishing Index outperformed the general market in the latest quarter. However, the full impact of the recent interest rate increase likely have not been reflected in the economy. Many media stocks seem to anticipate an economic downturn, but current fundamentals do not appear to be in a freefall and may be better than expected. If the economy further deteriorates from the recent or future rate hikes, it appears now that it may adversely affect the second half of 2023. Advertising pacings appear to be holding up well so far in the first half 2023. Notably, media stocks may begin to anticipate an improving economic outlook and overlook the weak fundamental environment in the second half.
Conventional thought anticipates that increasing concerns over an economic recession may prompt mortgage rates to trend lower in 2023. Furthermore, it is possible that the Fed may lower interest rates if inflation moderates, although the Fed is not currently anticipating rate decreases in 2023. Nonetheless, this paints a favorable picture for media stocks in 2023. Traditionally, the best time to buy media stocks is in the midst of an economic downturn. In addition, these consumer cyclical stocks tend to be among the first movers in an early-stage economic cycle and tend to perform well in a moderating interest rate environment. As mentioned earlier, the stocks may currently be oversold given the prospect that the current fundamental environment is better than anticipated.
What is the risk to this favorable outlook? We believe that the resurging Chinese economy may be disruptive. Within the last month, China’s economy has been reopened from Covid lockdowns, which may put pressure on global energy prices. Such a prospect may make the Fed’s fight on inflation more stubborn to combat, potentially throwing off our favorable outlook for moderating interest rates. Given the prospect that these stocks tend to outperform the market in an early-stage economic recovery, we believe it is time for investors to accumulate positions in the media sectors.
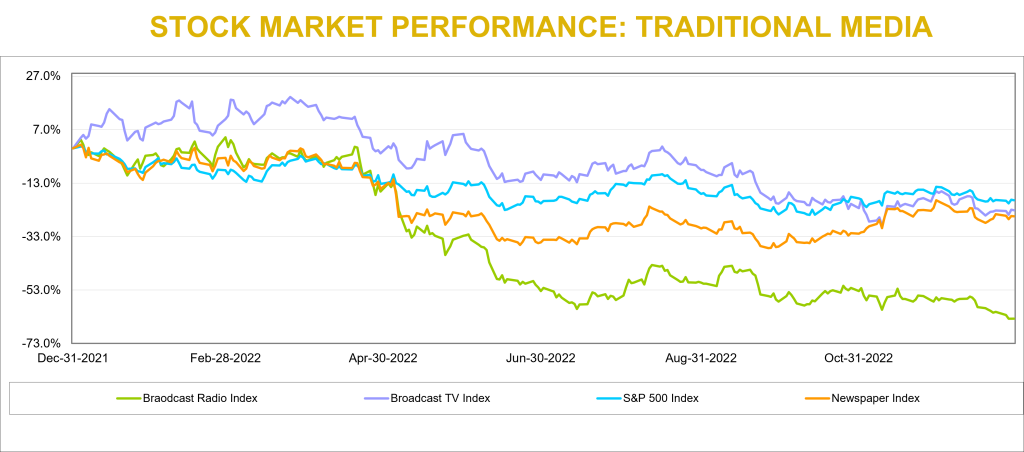
Traditional Media – Another Quarter of Moderating Stock Performance
Traditional media stocks underperformed the general market in 2022, with the Radio sector the hardest hit. The Noble Radio Index declined 64% versus 19% for the general market, as measured by the S&P 500, in a comparable time period. Television and Publishing stocks were down 23% and 25%, respectively, more in line with the general market returns. But there were notable company stock performance disparities within each sector, highlighted later in this report. Larger market capitalized companies performed better, which skewed the market cap weighted Indices.
Traditional media stocks seemed to have stabilized from the rapid declines in early 2022. The Publishing sector once again outperformed the general market in the quarter. Noble’s Television Index declined 3%, but this decline moderated from the 10% decline in the third quarter. The Radio industry still has not yet stabilized, with the Noble Radio Index down 15% in the latest quarter.
Broadcast Television
Will Netflix suck the air out of the room?
Netflix launched a new pricing plan on November 3rd which offers a basic tier with advertising at a low price point of $6.99. This compares with its previous tiers of $9.99 and $19.99 for advertising-free streaming. While reports indicate that the advertising platform is off to a slow start, we believe that the Netflix move could be disruptive to the broadcast television network business as its lower price basic service gains traction. It is likely that there will be some cannibalization from its higher pricing tier, but we believe that the move will broaden its subscriber base. While Netflix has not considered offering live sports on its streaming platform given the cost of sports rights, we believe that the potential success of its subscription/advertising tier may provide a platform to upend that decision. There is a strong tailwind for viewership trends on streaming platforms, which now exceed that of broadcast television viewing. A decision to enter sports will be a big deal and disruptive to network broadcasting.
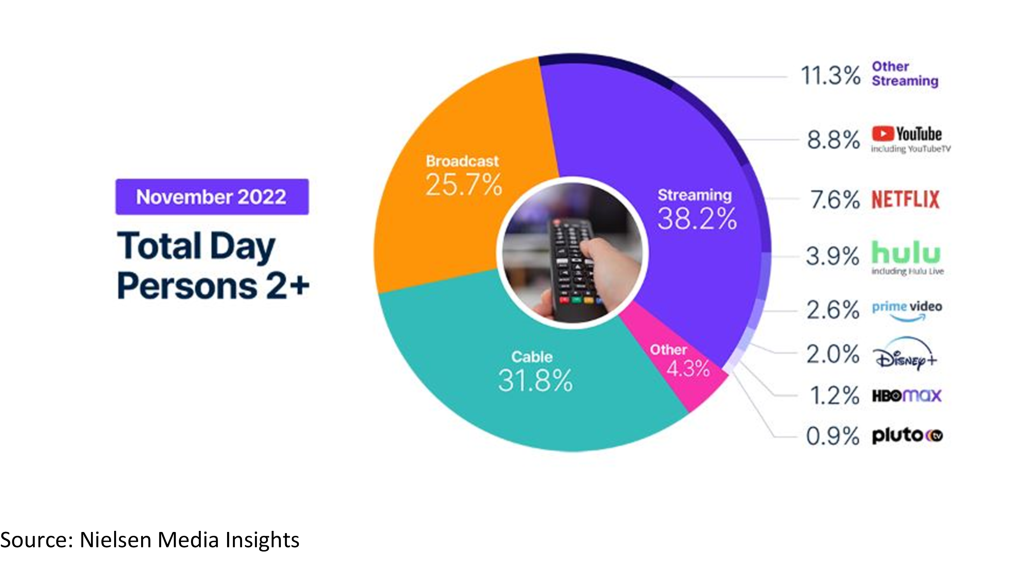
Streaming viewership not only eclipsed television viewing in July 2022, but also that of cable viewing, 34.8% versus 34.4%. In addition, based on the latest Nielsen data from November 2022, streaming now accounts for 38.2% of total viewing with Broadcast at 25.7% and cable at 31.8%, as shown in the chart below. While TV viewership increased 7.8% in November, largely due to sports content, streaming usage year over year was up more than 41%.
Scripps Plans To Expand Sports
The declining cable subscriptions and cable viewership, especially on regional sports networks, led E.W. Scripps to launch a new Scripps Sports division. This division plans to seek broadcast rights from teams and leagues and bring that programming to broadcast television. The company plans to obtain rights either in local TV markets where it can partner with local teams or on a national basis, utilizing its distribution on its Ion Network. It is important to note that ION is unique from other networks. Ion’s distribution is nearly 100% of the US television market given that it has local licenses and local towers in every market, it is fully distributed on cable and satellite, and is offered over the air. As such, we believe that Scripps offers a unique proposition to sports teams interested in building its audiences.
Will ATSC 3.0 Stream The Tide?
Furthermore, the broadcast industry appears to be more aggressively ramping its own streaming capabilities with the rollout of its new broadcast standard, ATSC 3.0. ATSC 3.0 is built on the same Internet Protocol as other streaming platforms which enables broadcast programming and internet content to be accessible in the car, on mobile devices, and in the home. While there are many opportunities for the new standard, services and offerings are still being developed. ATSC 3.0 offers promising opportunities for broadcasters to compete with streaming services in the future. We expect that the industry will make more announcements about this promising technology at future events, including the upcoming NAB Show, April 16-19 in Las Vegas, NV.
Are We In A Recession?
In our view, the current fundamentals may be better than the stocks project. Advertising seems to be holding up, post political advertising. Most companies in the industry reported strong Q3 revenue growth, influenced by a large influx of political advertising. The largest broadcasters, particularly Nexstar, have the largest EBITDA margins. The two stocks with the highest revenue growth in the quarter, Entravision and E.W. Scripps, saw their shares perform the best in the fourth quarter.
Notably, local advertising appears to be fairing better than national advertising. Based on our estimates, core local advertising is expected to be down in the range of 5% to 8%, with core national down as much as double digits. We believe that some large advertising categories like auto, retail and home improvement will show improving trends. The first quarter 2023 appears to be consistent with the fourth quarter. Broadcast network TV is another story, which we believe is weak. Network has potential heightened competition from streamers such as Netflix and Disney+ which have just launched ad-supported streaming tiers.
Is There Room For Upside?
Most TV stocks are trading in a tight range of each other. The biggest variance in stock valuations is Entravision, which is trading at 5.9x EV to our 2023 EBITDA estimate, well below that of its industry peers which trade on average at 7.7x. One might argue that Entravision, which has migrated to become a leading Digital Media company which contributes roughly 80% of its total company revenues, ought to trade at a premium to its broadcast peers, rather than at a discount. Investors appear to be somewhat confused by the company’s relatively low EBITDA margins, which is a function of how revenues are accounted for in its digital media division. We would also note that its capital structure is among the best in the industry, with a large cash position and modest net debt position.
As mentioned earlier, the Noble Broadcast TV Index declined 3% in the latest quarter, underperforming the general market’s 7% advance. E.W. Scripps, which increased 6% and Entravision, which increased 5% were among the strongest revenue performers in the third quarter. Among the poor performers were shares of Gray Television, down a significant 34% and Sinclair Broadcasting, which was down 24%. With the TV stocks down a significant 23% for the year, have the stocks already assumed that the industry is in an economic downturn? We believe that the stocks may be oversold based on the prospect that advertising is currently holding up in the first quarter.
Broadcast Radio
Digital Is Bolstering Performance
The radio industry index was the worst performing index in the traditional media segment, declining 15% in 4Q22 and 64% for the year. The radio industry is feeling the pressure that recessionary concerns place on the demand for advertising. In addition to increased competition for audiences from digital music providers and shifting advertising dollars from radio to a more targeted advertising medium, digital media.
For the third quarter Urban One and Townsquare Media top its peers with revenue growth of 9% and 8%, respectively. A common theme with companies that grew fastest was diversified revenue streams. Salem Media and Beasley Broadcast Group grew less quickly but are taking steps to further diversify revenue. Salem has diversified into content creation and digital media and Beasley is continuing to pursue a digital agency model. The median Q3 revenue growth rate was 1.5%, and the average revenue growth was -1%. The average growth rate of -1% is skewed due to the poor performance of Medico Holdings (MDIA). In previous quarters Medico benefited from Covid-19 vaccine advertising campaigns and ticket sales for an annual outdoor live event that took place in Q3 of 2021. Without Covid vaccine advertising and Medico’s concert being held in Q2 2022 instead of Q3 resulted in revenue declining 34% on a year over year basis.
After the 2022 calendar year ended, Moody’s downgraded Cumulus Media’s Corporate Family Rating to B3 from B2. Moody’s believes Cumulus Media will face a further decline in advertising demand as the economy weakens. Moody’s could upgrade its rating if leverage decreases to 5x as a result of positive performance and could downgrade its rating if leverage ratio increases to 7x as a result of poor performance. It should be noted that Cumulus has a large cash position of $118 million and could access an additional $100 million through an asset backed loan.
However, there are several companies in the radio industry with improving leverage profiles. We believe that radio companies are diversifying traditional revenue streams with digital revenue. In our view, companies that achieved a greater degree of digital transformation and are better shielded from macroeconomic headwinds. Townsquare Media, Cumulus Media, and Salem Media are among the cheapest in the group. For those companies with substantial digital media businesses that are growing rapidly, like Townsquare Media and Beasley, we believe that advertising pacings in the first quarter are likely to be positive. On the low end pacings are expected to be flat to plus 3% and may even be stronger, up 8% or more in the second quarter (although this is too early to bank). In our view, advertising for these companies do not appear to be falling off of a cliff as the stocks seem to project. Therefore, we believe that the Radio sector appears to be in an oversold position and should have some upside prospects in 2023.
Publishing
Publishing stocks had a pretty good quarter, up 18% as measured by the Noble Publishing Index versus the general market as measured by the S&P 500 Index up 7%. But the largest stocks in the index, New York Times and News Corp, were the only stocks that were up in the sector. Given that the Noble Publishing Index is market cap weighted, it was the reason that the Index was up in the quarter. Lee Enterprises was down a very modest 2% in the quarter. The relatively favorable performance of the index was primarily due to its largest constituents, News Corp. and The New York Times, which rebounded from -30% and -39%, respectively in Q2 2022, to -3% and +3%, respectively, in Q3 2022 and then up 17% and 16%, respectively, in Q4 2022.
We believe that Gannett, the nation’s largest newspaper company, continues to create a pall over the publishing group as it continues to struggle to manage cash flows with its heavy debt burden. In August, the company announced a round of layoffs of 400 employees and then announced another 200 in December. We believe that the company is trying to shore up its cash flow amidst a weak fundamental environment. Not surprisingly, GCI shares (-30%) were among the worst performers in the sector in the fourth quarter. To a large extent, the stock performance in the latest quarter reflected the various company results in Q3.
Q3 publishing revenue declined on average 1%, which excludes the strong revenue growth of the Daily Journal. The company benefited from its Journal Technologies consulting fees which bolstered revenues in its fiscal Q4 results. In addition, during the year, the company sold marketable securities for roughly $80.6 million, realizing net gains of $14.2 million. We have backed out the extraordinary results of the Daily Journal from our industry averages. Notably, Gannett had the weakest revenue performance in the fourth quarter, down 10%.
Notable exceptions to the overall weak industry revenue performance was The New York Times, up 7.5% in Q3 revenues, which reflected a moderation in revenue growth from the prior quarter of an increase of 12%. News Corp, declined 1%, which was well below the 7% gain in the prior quarter. Importantly, Lee Enterprises’ fiscal quarter revenue was down a modest 0.2%, a sequential improvement from the modest 0.7% decrease in the prior fiscal quarter. We believe that Lee’s digital strategy continues to gain traction and that the company is very close to an inflection point toward revenue growth. We continue to note that Lee’s digital subscriptions currently lead the industry. The company has exceeded all of its peers in terms of digital subscription growth in the past 11 consecutive quarters. Furthermore, over 50% of its advertising is derived from digital. Currently, roughly 30% of the company’s total revenues are derived from digital, still short of the 55% at The New York Times, but closing the gap.
Not only is Lee performing well on the digital revenue front, but the company has industry leading margins. Lee’s Q3 EBITDA margins were industry leading at 16.7%. We believe that Lee’s margins are notable given that it demonstrates that the company is managing its margins in spite of the investments in its digital media businesses. Its margins place it on par with its digital media focused peers, such as the New York Times.
LEE’s shares trade at an average industry multiple of 5.7x Enterprise Value to our 2023 adj. EBITDA estimate. Notably, the company is closing the gap with its digital media revenue contribution to that of New York Times. The New York Times carries a significantly higher stock valuation, currently trading at an estimated 15.8x EV to 2023 adj. EBITDA. We believe that the valuation gap with the New York Times should close.
DOWNLOAD THE FULL REPORT (PDF)
View the PDF version for segment analysis, M&A activity, and more…
Noble Capital Markets Media Newsletter Q3 2022
This newsletter was prepared and provided by Noble Capital Markets, Inc. For any questions and/or requests regarding this news letter, please contact Chris Ensley
DISCLAIMER
All statements or opinions contained herein that include the words “ we”,“ or “ are solely the responsibility of NOBLE Capital Markets, Inc and do not necessarily reflect statements or opinions expressed by any person or party affiliated with companies mentioned in this report Any opinions expressed herein are subject to change without notice All information provided herein is based on public and non public information believed to be accurate and reliable, but is not necessarily complete and cannot be guaranteed No judgment is hereby expressed or should be implied as to the suitability of any security described herein for any specific investor or any specific investment portfolio The decision to undertake any investment regarding the security mentioned herein should be made by each reader of this publication based on their own appraisal of the implications and risks of such decision This publication is intended for information purposes only and shall not constitute an offer to buy/ sell or the solicitation of an offer to buy/sell any security mentioned in this report, nor shall there be any sale of the security herein in any state or domicile in which said offer, solicitation or sale would be unlawful prior to registration or qualification under the securities laws of any such state or domicile This publication and all information, comments, statements or opinions contained or expressed herein are applicable only as of the date of this publication and subject to change without prior notice Past performance is not indicative of future results.
Please refer to the above PDF for a complete list of disclaimers pertaining to this newsletter